
Following the Prime Minister’s pledges on tax, the commentators are at work dissecting the implications. The Financial Times in particular is critical. An important fact seems to have been forgotten.
The evidence of the past century is that there is a practical limit to how much tax a government can take.
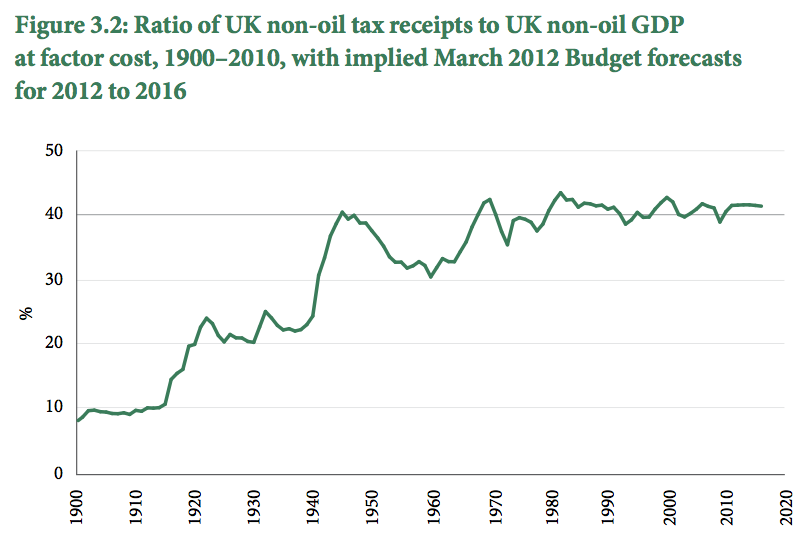
During my lifetime, it has not mattered whether governments have been of left or right, whether they have appeared to lower taxes or raise them, about 40% of GDP has been taken in tax, little more, little less. GDP can be measured several ways, which alters the numbers, but the evidence remains: there is only so much the British people will pay.
Here’s the relevant chart from the report of the 2020 Tax Commission:
They write (I omit cross references):
There appear to be limits to the taxable capacity of the British economy, and taxes do not seem to be able to raise more than 40 per cent of national income. That is the result both of political constraints and of taxes harming the economy and thereby shrinking the tax base. High marginal rates of tax lead to the migration of economic activity to lower tax jurisdictions, create a deadweight loss of economic activity that does not take place, and reduce taxable income. That puts a certain practical limit on spending as a share of national income.
Put simply, people will not stand still and be taxed: tax too much and revenues reduce. That is what has happened under this government with capital gains tax: increasing the rate reduced the revenue.
There are at least two important implications. There is no point pretending that yet higher taxes will yield more revenue for the Government. There is reason to believe that lowering rates moderately will not make much difference to overall revenues as economic activity picks up and we all become more prosperous. Dynamic tax modelling at the Treasury will have a part to play in forecasting results and it may already have guided policy.
David Cameron’s full speech may be found here. It was a great one.


Perhaps taxation seems to hover at a consistent proportion of GDP, but it might be varying an awful lot more in terms of the actual sense of deprivation it places on the populace.
GDP calculations themselves include govt. spending, and government spending as a proportion of GDP varies.
http://kr.nlh1.com/images/200912/PFW%20UKPublic%20SPending.gif
This makes the picture a bit more confusing. The figures I’d like to see are very hard to obtain for the UK. I’d like to see median per capita income *as a proportion of M4* vs median per-capita taxation *as a proportion of M4*.
It may be that public spending programmes (partially funded by money borrowed on the markets) are the only effective way to funnel newly created created directly to the broad populace (thus acting as a crude but well-intentioned counterbalance to the ‘trickle-up’ effect of our broken system of credit creation).